The Limits of Social Networks
Though we have mostly gone our separate ways over the past year, I find that I am attached to the idea of the LuAn collective and want to keep it going just a bit longer. After all, you never know when you might need a data viz blog that you co-run.
As a second year student in the English department at UCSB, I am gearing up to take (i.e. reading madly for) my qualifying exams this June. As luck would have it, I am also finishing up my course requirements this quarter, so I find myself in the…unenviable position of writing a paper on a topic that would ordinarily lie far outside my interests in the 19th century English novel: William Faulkner. So I did what any digital humanist with an unhealthy interest in visualization would do in my situation – I made a graph.
I wanted to write a final paper for this course that reflects my theoretical interests and would allow me to continue developing a subset of my digital skills. Of course, trying to get all of my interests to move in more or less the same directions is like herding kittens, but I had been seeking another opportunity to think through a novel using a social network graph and, well, I wouldn’t have to start from scratch this time. I knew how my graphing software, yEd, worked and I knew how long it took to turn a book into a collection of Excel cells denoting conversations (20% longer than you think it will take, for those of you wondering). So why not create a social network graph of one story in Yoknapatawpha?
Don’t answer that question.
Light in August is widely considered to be the most novel-like of Faulkner’s novels, which made it a good choice for my project. After all, I had experience turning a novel-like novel into a social network graph and no experience whatsoever with a text like The Sound and the Fury. Much as I was intrigued by and even enjoyed The Sound and the Fury and Absalom, Absalom!, the prospect of figuring out the rules for graphing them was…intimidating to say the least.
For all its novelistic tendencies, Light in August is still decidedly Faulknerian and, in order to work with it, I found myself either revising some of my previous rules or inventing new ones. When I worked on George Eliot’s Daniel Deronda, I had used a fairly simple set of two rules: “A bidirectional interaction occurs when one named character speaks aloud (that is, with quotation marks) to another named character. A unidirectional interaction occurs when a named character speaks aloud about another named character.”
Here are the Faulkner rules:
- When one character speaks to another, that interaction is marked with a thicker, dark grey arrow.
- When one character speaks about another, that interaction is marked with a thin, dark blue arrow.
- When one character speaks to another within another character’s narration (i.e. X is telling a story and, in it, Y talks to Z), that interaction is marked with a thicker, light grey arrow
- When one character speaks about another within another character’s narration, that interaction is marked with a thin, green arrow.
There are several changes of note here. First, I learned more about yEd and figured out how to put properties like line size and color in the spreadsheet itself so that the software would automatically map color and line weight as appropriate. This meant I could make finer and clearer distinctions than last time, at least in terms of showing kinds of communication. Second, I changed the rule about quotation marks because quotation marks don’t necessarily connote audible speech in Faulkner, nor does their absence connote internal monologue. I relied entirely on the dialogue tags in the text to decide whether a sentence was spoken aloud or not. Finally, I changed the rule about named characters. All speaking characters are represented in the graph, regardless of whether or not we are ever told their names. Had I not changed this rule, the number of characters of color represented in this graph would have fallen from 15 to 3. There are 103 distinct nodes in this graph, which means 103 characters speak in this text.
Jeffrey Stayton, in an article entitled “Southern Expressionism: Apocalyptic Hillscapes, Racial Panoramas, and Lustmord in William Faulkner’s Light in August” (which, in the interest of full-disclosure, I am still in the middle of reading), discusses how Faulkner figures racial landscapes in Light in August as a kind of Southern Expressionism. It is fitting, of course, that one of Willem de Kooning’s expressionist paintings is based on and entitled “Light in August”. But this graph highlights the relationship between fading into the background and remaining unnamed, it shows how easily racial landscapes can become racial backgrounds and how easily it is to elide the unnamed. In the Victorian novel, a certain charactorial parsimony seems to ensure that everyone who speaks is named. Daniel Deronda is 800 pages long and contains 62 character nodes. Light in August is 500 pages long and contains 103. If you remove all the unnamed characters, there are 44 character nodes. (For those of you counting, thats 38/88, close to half of the white characters, and 12/15 or four fifths of the black characters. The other 8 are groups of people, who seem to speak and are spoken to fairly often in this text.)
There are several ways to interpret this difference and I am loathe to embrace any of them without, frankly, having done more work both with Faulkner and with the Victorian novels. One of the things I find striking, though, is that Light in August seems to be making visible (though only just) things that are either not visible or entirely not-present in Daniel Deronda. Light in August is told from different characters’ viewpoints and the narration always locates itself in their perspective and confines itself to what they know. So the graph becomes a record not only of what they have seen, but also of how they have seen it.
I can hear some of you grumbling “What graph? You haven’t shown us a graph yet!”
My apologies. For that, I will give you three. Anything worth doing is worth overdoing.
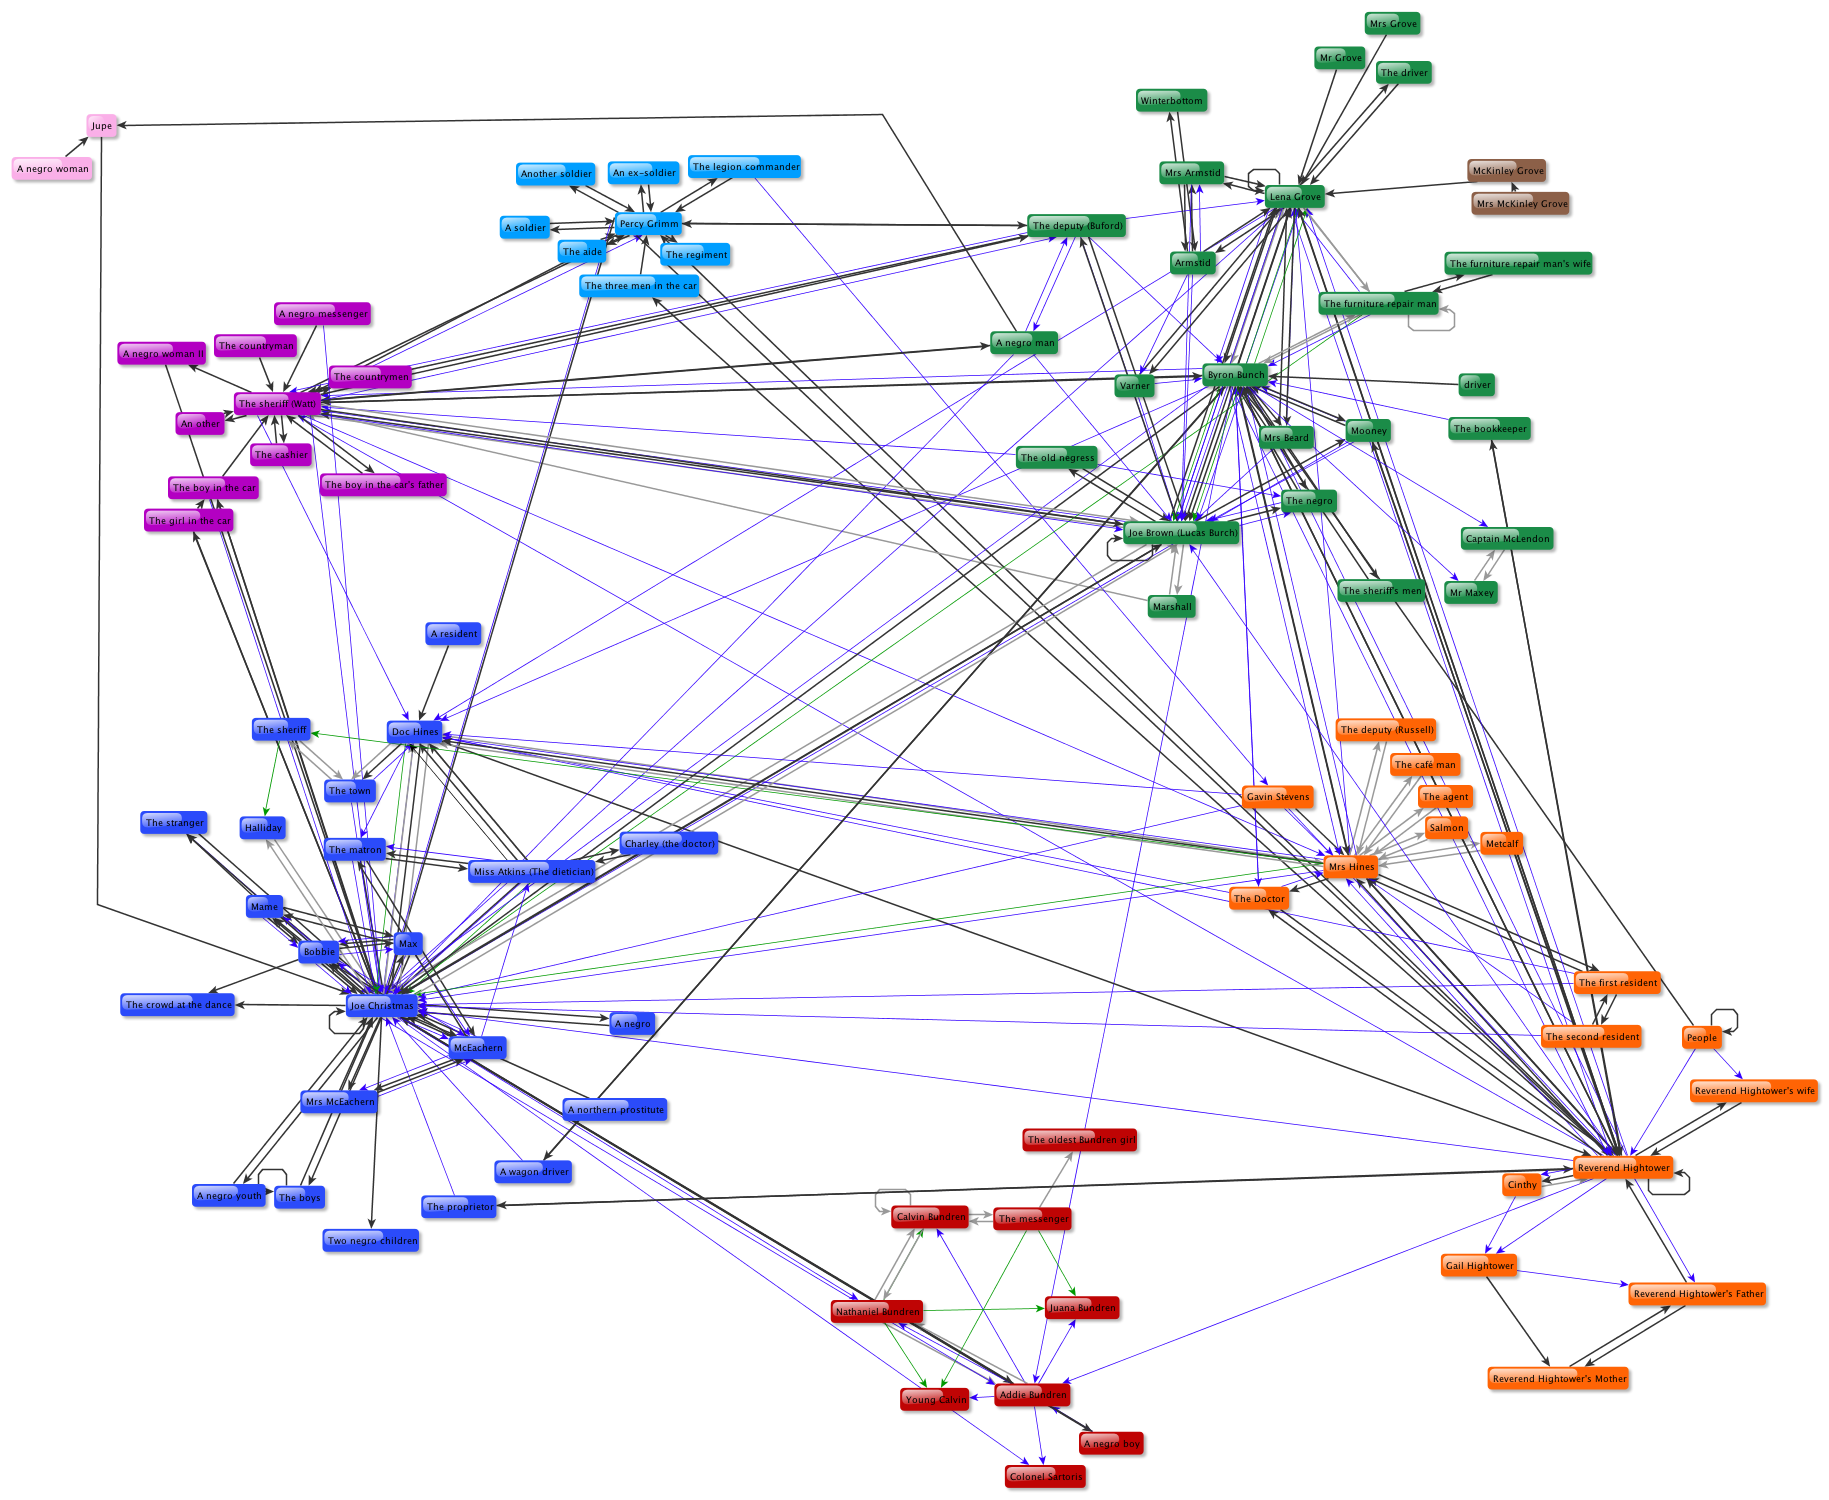
1) The first graph.
 Click to see it in full size.
In this graph, color corresponds to importance, as determined by number of interactions. The darker the color, the more interactions that character has had. That dark red mark in the middle is Joe Christmas.
2) The graph without the unnamed characters

Click for full size.
Colors mean the same here that it did in the previous graph.
There are several differences between the two graphs. Obviously, the second is legible in a way that the first one is not, which is not entirely a virtue. When it comes to graphing, legibility and completeness tend not to walk hand in hand. The more you leave out, the more you can see so, contra-positively the less you can see, the less you have left out. The best-of-both-worlds solution is to use both images.
Interestingly enough, there are no unconnected nodes in the second image, even though I deleted half of the nodes in the graph. That surprised me. I expected to find at least one person who was only connected to the network through one of the unnamed characters, but there’s no such person. And many of the people who remain are not characters I would consider to be important to the story (Why has the entire history of the Bundren family remained more or less intact? Who is Halliday, anyway?)
These are questions to be solved, or at least pondered. They are, at any rate, questions worth asking. If the network remains intact without these characters, what does their presence signify? What has changed between the first graph and the second?
After all, I do have a paper to write from all of this.
I promised you a third graph, did I not? This one moves in a rather different direction. As part of its ability to organize and rearrange your graph, yEd has a grouping functionality and will divide your graph into groups based on the criteria you choose. I had it use natural clustering.
A grouping into natural clusters should fulfill the following properties:
- each node is a member of exactly one group,
- each node should have many edges to other members of its group, and
- each node should have few or even no edges to nodes of other groups.
yEd gave me 8 distinct groups, two of which had only two nodes in them.
As always, click for full-size.
I assume that when yEd said that the groups would have few or no edges to nodes in other groups, it was doing the best it could with the material I gave it. I then had yEd rearrange the positions of the nodes so that the centrality of a node’s position within a group indicates how many connections it has.
What I love about this graph is how it divides Light in August into a set of six interconnected but distinct narratives. Each group larger than two centers around a specific character or group of characters involved in one thread of narrative. Joe Christmas, who is arguably the main character, has one section (along with a plurality of the other characters of color), Lena Grove, Bryon Bunch and Joe Brown are all grouped together in another and, while they talk about the characters in Joe Christmas’s section quite often, they have only three conversations with the characters in that group. Those are the two largest groups. Percy Grimm, for all that he only appears in one chapter, manages to collect 7 other nodes around himself and does seem, in his own way, to be the protagonist of his own story who just walked into this one for one chapter and then left again. He is also the only named character in his section.
Social network graphs are, for me, a way of re-encountering a text. They strip away most of the novel and model only a small portion of what is present in the text, but that portion becomes both visible and analytically available in a new way. (I think seeing and visibility will become a theme in this paper, once I write it.) The title of this course is “Experimental Faulkner”. I like to think that this qualifies.
