In the last few months, Sefaria.org has added several tens of thousands of new links to the site, mostly through judiciously crawling the wikitexts archive. The combination of human-scale translations and data-scale linkings is fascinating – the sheer number of links would take ages for a person to do, but as time progresses, we must be approaching the maximum number of links that can be added algorithmically. I’d mentioned, in a previous post, that there’s a huge difference between collecting exact quotes and subtle allusions. It would be interesting to see what happens to Sefaria as it moves towards discovering the latter.[1]
However, it’s also pretty interesting to see the evolution of the former.
Before I return to the circle of text, special thanks to Josh, who recently got a new desktop and donated his old one to me after putting in a new solid state drive. It has become my official work machine (when not also being used to play Portal. Again.)
So, when last we left Sefaria, they were at 87,000 or so links between texts. By August 25nd, they had over 150,000. By September 22nd, they were up to 300,000. So my first question, as you might imagine, is as follows: assuming that I use the same layout algorithms for each, how do the graphs compare to one another?
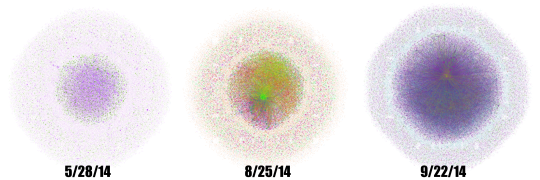
These three graphs were all created using the force directed OpenOrd layout algorithm in Gephi, mostly because it’s the only layout other than isometric that can really handle this much data.
Arguably, the first thing we’ve proved is that Alexander Galloway is right in The Interface Effect, “Only one visualization has ever been made of an information network, for there can only be one” (84). Galloway observes that the style and structure of network visualizations all look the same or, more accurately, all use the same aesthetic codes to say the same things and what they tend to say is that this object is big and interconnected—each image fundamentally exists as a symbol of the network without any kinds of representation.
Which leaves me, as a reader and student, with two series of questions. The first—which I am going to hold off on answering until my final post in which I plan to discuss questions of worth—asks what the aesthetic and poetic value of these visualizations are? What, in the strongest sense of the term, do we do with them as objects that speak about an archive or even as objets d’art?[2]
But we’ll get to that later. In the mean time, let us ask a different kind of question. If we take each graph as the symbolic representation of algorithm working on data, how do we use that representation to reorient more traditional forms of inquiry? This is part of the humanities’ continued break with what I think of as the ordinary uses of data visualization wherein the purpose of the image is to convey to the human eye what the algorithm has learned. It’s a method of displaying new knowledge that has been interpreted by virtue of having been computationally mediated. But these visualizations work slightly differently. While their job is still to show us Sefaria’s output in a manner readable to our eyes and brains, they exist as the starting point in humanist inquiry rather than the purpose of it. I see these graphs as pointers, methods of discovering or uncovering areas in the network that are of interest to scholarship. The visualizations, taken separately and together, are a way of telling us to look here.[3] Why is this node different from all other nodes? When we line up these three images, which look more and more like the multicolored Eye of Sauron, how do they draw our attention and what inquiries do they suggest?
With that in mind, here are some questions I thought of:
– What is the node that looks like a lens flare on the right-hand visualization?
– Why do each of this images have a halo?
– Is the largest node the same in each of these images?
– Why do I only remember to check the repository at the end of the month?
So these are questions we can answer, except perhaps that last. I will take on the first two. The lens flare, interestingly enough, is a single chapter from Tanna Debei Eliyahu Rabbah. If you were expecting something a bit more well-known and your response was “who now?” rest assured, you’re not alone. I was surprised too.
Tanna Debei Eliyahu is a work of midrash, which means that it uses biblical verses to craft narratives and make arguments about the nature of the world (rather than, say, use them as prooftexts for legal decisions). David Stern describes it as an “exposition of themes and ideas, but one whose coherent presentation is always being sidetracked by the lure of exegesis” in his book, Parables in Midrash.
So why does its 18th chapter have so many edges stretching out of it?
Here, by the way, is what it looks like when graphed isometrically:
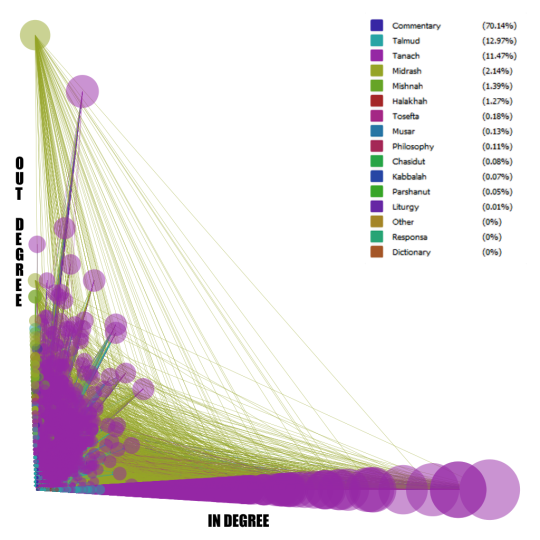
As to why, the simplest answer is because that chapter refers to an astounding 113 different verses in the Bible. Nothing else, as the graph shows us, comes close. The passage in question begins with an exegesis of a verse from Lamentations and can be found here. For context, the other chapters have between 3 and 35 biblical quotations in each section.
So there’s a research project for someone interested in Midrash. Is there something unique about the contents of this chapter that matches the odd data we’ve gleaned about it? Why does this section require so many prooftexts? Are those texts similar across the entire section or is there an evolution of their content? Of course, I’m not in the business of interpreting Midrash, at least not at this point in my career. The rather serendipitous revelations of this research remain as pointers.
So much for micro-level drilling down. Now let’s go back and take this opportunity to look at the evolution of the archive. This graph is a testament to Sefaria’s growth, but more importantly to us, it shows what the database looks like as it approaches a more accurate representation of the interconnectedness of Jewish texts.
What strikes me as interesting, at least in this network, are the regions of growth. The centers become denser and more intricately connected while the halo around the outside remains the same diffuse constellation it had been more or less since the beginning. According to that view, the nodes around the outside remain the same, while new nodes add themselves in to the central cluster. Given the scale of the images versus their pixel density, I went back to Gephi itself to check the compositions of each one.
Here’s the image again, just as a refresher:
In the May graph, the outermost ring is composed of less prominent Biblical verses and their commentaries, along with the occasional Talmudic fragment that comments on them. The inner ring, on the other hand, comprises the Talmudic pages that lack links to anything other than their own commentaries. The August graph works on the same obscurity principle and, despite appearances, the presence of a text in the inner or outer ring is determined by how many edges it has. The inner ring is made of texts with several connections to other texts that make up their own little clusters, mostly fragments of the Talmud or biblical verses. On the other hand, the texts in the outer ring tend to have only two or three edges. They’re just packed more closely together, which is what leads to the thicker looking band of color. Whether a cluster ends up in the inner sphere or in one of these outer rings is determined by both the number of edges and whether one of those edges connects to the massive nodes in the center. And, finally, we reach the September graph. Again, same basic principle, but the contents are slowly shifting inwards. Nodes that, in previous graphs, appeared in the outer circles have now gained access to the inner sphere (where they have been indoctrinated in the secret mysteries of graphs practices, no doubt), while the outer ring includes commentaries on and translations of biblical verses (which tend to only have one edge, to the verse they are translating).
This suggests that, as new nodes are added, earlier nodes with fewer edges make more connections and gravitate towards the center of the graph while some of the newer, more obscure nodes, take their place on the outskirts. Alternatively, the nodes themselves retain the same number of connections, but the nodes to which they are connected gain more edges and they are drawn to the center by that connection. One very popular biblical verse can draw in an extraordinary number of commentaries, each of which only connect back to that verse. There is a point at which this will have to stop; the nodes currently in the outer circle are quite unlikely to build sudden networks of communications, given that the Aramaic translations, for example, are rarely referenced within the literature.
I’m not surprised to discover that Sefaria’s database was built up in this fashion; the earlier iterations were more interested in setting up the database with texts that readers would likely want to reference. Pseudo-Jonathan was probably not a priority. If the previous question drew our attention towards the anomalously overconnected, this question turns our gaze towards the obscure. Texts like the Aramaic translations catch my eye because they are precisely the kinds of texts I would expect to find in the far outer reaches of the graph. What else is out there? Are there any similarities between the texts with few connections? And what kinds of similarities might we look for?
The appeal of big data (for a given value of big) is that it promises us the possibility of looking at the ordinary en masse rather than extraordinary exemplars. The problem is deciding what to do with the ordinary now that we’ve found it.
I considered looking at only the nodes with 20 edge or fewer, but that turns out to be 99.2% of the nodes. My next step was to reevalute my definition of “a few edges” and I went back to the graph with what I thought was a more reasonable number. Going down to 4 edges brought me all the way to 92% of the nodes visible, but less than 20% of the edges. And, finally, 75% of the nodes on the graph only have one edge. That’s about 228,000 nodes out of 305,000. As a note, fewer than 5% of the edges are part of this graph, which means that 25% of the nodes are responsible for 95% of the edges.
My original goal, for those who remember, was to look at these nodes with few connections and see what they have to say for themselves. This is where Gephi becomes less useful and so I ended up back in Excel, messing around with spreadsheets. (Yes, I know, there are better methods. But I know how to use excel!)
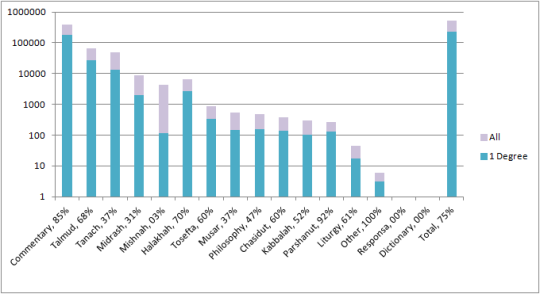
Percentage-wise, most of the commentaries are dead ends. Which is to say, they have one edge and that edge connects to the biblical verse upon which they are commenting. Interestingly enough, the same is true for the Halakhic writings. 70% of those texts only have one edge. Which suggests a chain of transmission that only references the conclusions of a previous work and that only has its conclusions referenced by the next in the chain. And given that we are working with with individual verses in the Bible and sections of sections in Halakhic literature, it’s not surprising to find such divisions.
On the other hand, only 3% of the Mishnaic nodes have just one edge. Given the rest of the graph, that is rather an anomaly.[4] My first impulse was to blame the Babylonian Talmud (as one does) except that only accounts for 37 of the 60 tractates. Then I remembered that the absence of the Jerusalem Talmud from my scholarly interests does not disqualify it from having an effect on the graph. And yet both the Babylonian and the Jerusalem Talmud leave out the entire order “Taharot” with the exception of one Tractate. If one sixth of the Mishnah remains uncommented, shouldn’t the number of nodes with only one edge be higher?
Apparently not. I was still inclined to blame the Gemara’s selective nature for this particular graph, but it pays to be thorough. I checked the list of the Mishanyot with only one edge and, while the majority of them were from the minor tractates not discussed in the Babylonian Talmud, there were still random sections of the Mishnayot even in the more well known tractates, such as those dealing with marriage, damages, ethics. So there’s another question for another researcher. What is so strangely uninteresting about these sections of the Mishnah?
Finally, I want to return to Tanach as I found those results to be anomalous in a different direction. I found it hard to believe that 37% of the verses in Tanach have only one edge, which is to say that only one commentator or translator has taken the time to interpret them.
My instinct was right in this case. Sefaria counts translations as part of “Tanach” rather than as commentaries, despite the translators Onkelos and Jonathan taking full advantage of translation as a form of interpretation. So when I checked how many of the Tanach nodes were actually translations, I found that the number was roughly 33%. Conveniently, when I excluded the translations, I found only 4% of Tanach nodes had one edge. So the math works out nicely and there’s our 37%.
Some off the cuff Sefaria testing also suggests that some of these numbers are not accurate. There are some verses listed in my 1 degree column that clearly have more than one connection on the site itself. But that may be an artifact of the work that continues to be done on the site. Current stats from the site say that they’re up to 400,000 edges.
Perhaps it’s time for another multicolored Eye of Sauron.
As my readers have undoubtedly noticed, these forays into visualization are not focused on specific research agendas. I’m using this space to figure out what it means to work with visualizations in the humanities, what kind of work they can do and what we can ask of them. I don’t want answers, I simply want new and interesting questions. And I want to work with the texts on a visceral level, something that makes creating these visualizations surprisingly rewarding. I know that all the work we do is about creating knowledge, but it feels more visceral when I can watch the shape and size of the textual representations change on the screen. Taking ownership and making knowledge in full technicolor is what we’re all about here.
-
Alternatively, one could ask whether we could build a program that looks for biblical allusions. Especially within the 24 books of the Bible, the language is constrained enough that we might be able to manage it. It would be interesting to note, first of all, how many of those linguistic connections were already set out in the Talmud and Midrash using the rules of “hekeish” or the recurrence of root words. And to compare those with the ones generated by a machine. ↩
- The problem of art is a tricky one, because we don’t see ourselves as in the business of creating beauty. We study it and, if we can, we create it in addition to our critical analysis. But that’s not quite the same thing. ↩
 “Hey! Listen!” ↩
- For the purposes of this conversation, I’m leaving out the categories “Other”, “Response” and “Dictionary” as they make up a total of 6 nodes out of 305,000. ↩

Comments on: "Sefaria III: Comparative Graphing" (1)
[…] post is distinct from the previous ones, which can be found here: part 1, part 2, and part 3, in that I’m finally going to move away from looking at the images themselves and focus instead […]