Bar Graphs and Human Selectiveness
Two weeks worth of struggling with R and putting in my own texts (feel free to guess which one I used) has left me feeling less accomplished than I would have liked, but less filled with encroaching terror as well. I am capable of following instructions and getting results, so while the art of doing new things (and really understanding the R help files) is still beyond me, I think I have enough material to start talking about Daniel Deronda again.
Daniel Deronda is a text that seems split into two halves. One of the things I discover when I reread this book is that there are many more chapters than I remember with both Deronda and Gwendolen “on screen together”. So are these two separate stories or are they two utterly intertwined texts?
In order to test how separate the two storylines are, I looked at the word frequencies of both “Deronda” and “Gwendolen” in each chapter to see whether they were correlated. So, in this case, a positive value means that Deronda showing up in a chapter increases the likelihood of Gwendolen showing up while a negative correlation means the opposite.
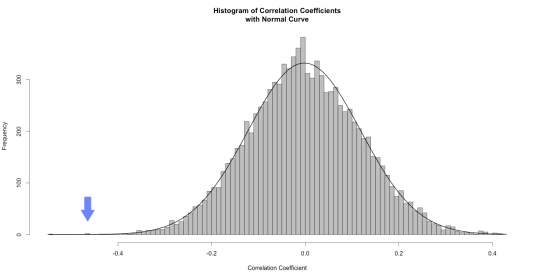
The correlation between Deronda and Gwendolen is -0.465. (As a reminder, correlations run from 1 to -1). So that’s actually pretty high, given that book chapters are complex objects and I know that they interact a fair amount over the course of the book. But there’s actually a better way to test for significance. We can look at the likelihood of this correlation having occurred by random. Again, drawing on Text Analysis with R, by Matthew Jockers, I had R rearrange the appearance 10,000 times and then generate a plot of what the correlations were. Unsurprisingly, it looks like a normal curve:
So if the frequency of each name per chapter was distributed randomly, you would be statistically likely to see little correlation between them. For those interested in some more specific numbers, the mean is -0.001858045 and the standard deviation is 0.1200705, which puts our results over 3 standard deviations away from the mean. That little blue arrow is -0.465.
All that says, of course, is that it’s highly unlikely that these results occurred by chance and that they are, in some sense, significant.* Which, to be fair, no kidding. My initial, subjective reading told me they were negatively correlated as well. And there has to be a better reason to do this kind of work than just to prove one’s subjective reading was right.
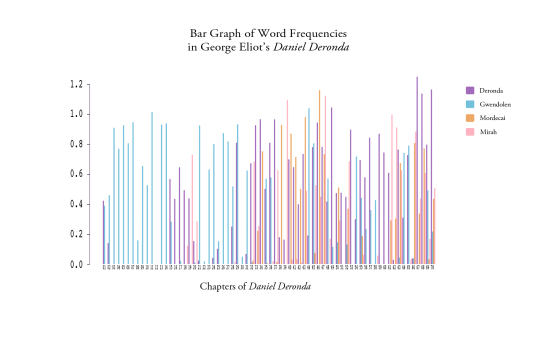
Which is where our next graph comes in. Now that I know that the two are negatively correlated, I can turn to the actual word frequency per chapter and see what the novel looks like if you study character appearance.
And, for fun, I threw in two other characters who I see as central to the plot to see how they relate.
I highly recommend clicking on the graph to see a larger view.
Here’s where things get interesting to the human involved. The beginning of the novel happened exactly as expected – Eliot starts the story in medias res and then goes back to first tell us Gwendolen’s history and then Deronda’s. And then the name game gets more complicated about halfway through when Mirah and Mordecai** enter the picture. By the last few chapters, there is very little Gwendolen and the story has settled firmly around Deronda, Mirah and Mordecai. All of this, again, makes sense. But it is nice to see the focus of the book plotted out in such a useful manner and it invites two kinds of questions.
The first is based on the results; going to chapters with a surprisingly high mention of a certain character, like Deronda’s last few chapters, and attempting to figure out what might be going on that causes such results. Why, after all, is Daniel the only one to venture up into the 1.2% frequency? Is there something significant about the low results around 50 and 51? What’s going on there?
The second kind of questions that this graph invites are questions about me. Why did I choose these four characters? I think of them as the four main characters in the story and yet there’s certainly a good argument to be made for at least one other character to be considered “main”.
If you’ve read the book, feel free to guess who.
Why did I leave out the frequency data for Henleigh Mallinger Grandcourt?
Honestly, I completely forgot he was important. It’s not that I don’t remember that the Earl of Grantham had an evil streak in his youth, it’s simply that I don’t think of Grandcourt as a main character in the book. That might be because one doesn’t usually think of the villain as “the main character” or it might be because I am more interested in the story of Deronda and 19th century English Jewry.
As it happens, I noticed Grandcourt’s absence because of that odd little gap in Chapter 12 where absolutely no one is mentioned. What was going on there?
I went on Project Gutenberg, checked the chapter and said “Oh. Oops.” This is the only chapter entirely (and possibly at all) from Grandcourt’s perspective, hence no mention of any other character. So why didn’t I redo the graph with Grandcourt included, given that he’s important enough to have his own chapter?
Okay, yes, sheer laziness is part of the answer, but there is another reason. Chapter 12 is the chapter in which Grandcourt announces his intention to marry Gwendolen. And notice whose name entirely fails to appear in the chapter…
This data doesn’t exactly tell us anything new – we have ample proof from Eliot that Grandcourt is one of the nastiest husbands in the British canon. But this detail invites a way of looking at people’s interactions categorized by recognizing another person by the simple act of naming them, which makes this the second time that randomly playing around with visualizations has led me towards the question interpersonal interpellation as related to empathy.
So what do you all think? What does the graph say to you? Do you think this is a valuable way of approaching a text? And am I getting kinda hung up on this question of simply naming as a measure of empathy?
Comment below!
—
* With the obvious caveat that this was a book written by a woman rather than a random letter generator so of course its results did not occur by chance, what this graph really lets us see is whether the negative correlation between the two characters allows for meaningful critical discourse. Anything under -0.5 is not really considered significant in scientific terms, primarily because it’s not useful for predictive validity, but because we’re not interested in predictive validity, we’re interested in the possibilities of storyline division, the graph validates the hunch that there’s some kind of distinction.
**SPOILER ALERT – Mordecai is actually the combined occurrence of the names Mordecai and Ezra, for reasons obvious to anyone who has read the book.

