Playful Visualizations at Work, Working Visualizations at Play

Posts tagged ‘Sefaria’

Sefaria IV: The Whys of Data Visualization

Welcome to the final post in this Ludic Analytics series on Sefaria. While my research itself is ongoing, this part of the project where experiment with the images I can make and ponder their value, has come to a close.

This post is distinct from the previous ones, which can be found here: part 1, part 2, and part 3, in that I’m finally going to move away from looking at the images themselves and focus instead on what their larger purpose is. But before I get to that, an important announcement.

All the data from this project – all three datasets, the .gexf files, the .csv exportable versions and some of the high res images are now available on my Github page for the Sefaria Visualization project. Sefaria is serious about its commitment to an open repository and I share that commitment with them. So if you want to grab any of these datasets and play around with them, please do so and I would very much like to see what you do with them.

A word of caution, however. These datasets are large and Gephi requires a lot of memory. All three datasets, but especially the August and September ones, will take forever to run on a computer with less than 8GB of RAM. Run them in the background on a machine that can handle it and assume that any layout algorithm other than plotting data points on a 2D plane will take some time to render. So, if you’re like me, and started doing this on a 2011 MacBook Air with 4GB of memory…don’t. And if you are familiar with software other than Gephi and prefer to use that, be my guest and do let me know about it.

All the data can be found here: Sefaria Data Visualization Project.

And now, onwards!

What is the value of this research?

As we all know, answering broad and general questions is difficult, so let’s break this one down a bit.
1. How does this kind of work – making visualizations and thinking about networked Jewish text – enhance the traditional experience of studying Jewish texts in a Jewish environment?
2. How can an academic researcher make use of these visualizations and to what degree does she need to become an expert in network theory to do so?

There. That’s much less intimidating.

Going in order, the first question really asks whether this kind of work has value within the traditional classroom. Given that the teaching of Jewish texts often focuses on the micro level and dwells on one topic for a very long time, this kind of visualization work seems like an important counterpoint to that kind of study. If students, as part of their explorations of Jewish texts, are learning how to trace a legal ruling from its source in the Bible to the modern day responsa on the topic, turning that unbroken line of tradition into a network that they can see could be really interesting. Rather than thinking linearly, they can look at specific ideas as clusters. And, starting with one of those groups, students could begin to think in terms of idea clusters – what groups of legal decisions come from verses that are right next door to one another.

None of this is new information and all of it could, in theory, be taught without the aid of images at all. But the images make it much easier to to think in a networked way.

And this is reflective also of the change that has come about with giant repositories like the Bar Ilan CD that contain an extraordinary number of sources or even Sefaria itself. We have access to the legal system as a whole in a way that really did not exist before the age of the computer. We’re going to have to think about how we want to access that system in a way that is both true to traditional forms and takes advantage of technology.1

The goal of teaching students about Jewish texts is only partially to familiarize them with the narratives they hear in synagogue and the laws that structure their lives. The other, more difficult job is to create a bond between the student and the text(s). And we do that by making the books tangible and meaningful, but we can also do that by making the text network tangible (metaphorically speaking). If we create emotional connections through interacting with texts and those connections have a profound influence on what we learn and how,2 we should be able to build on those connections through even less traditional forms of interaction. Such as making a graph.

So why is this kind of work useful in the classroom? Because it provides another way of accessing meaningful texts, one that can help students make connections they could not otherwise see and connect with the text in a way that deepens their appreciation for it.

Yes, this approach might make understanding a particular section of Jewish law a bit easier. But I’m much more interested in the way that it reshapes our relationship with all the texts as a whole. Not exactly what we can see, but how it changes the way that we look.

Which brings me to my second question, which I have partially answered in previous posts on this topic. How does an academic make use of this research?

I’ve given several examples of using the graphs as pointers towards interesting features in the texts. The strangeness of tractate Sukkah that I addressed here and the connections in the 18th chapter of Tanna Debei Eliyahu that I discussed last time are good examples. Both of these are interesting features noticeable only when examining the graph and each leads to a very different kind of research. As Sara pointed out in the comments, the results I was seeing for Sukkah came from the work her Talmud students did with Sefaria. So while not a feature of the text itself, this node opens up a conversation about using Sefaria in the classroom and data collection in a large, open-source project. Conversely, research into the 18th chapter of TDE would require a very different approach as the question, as far as I can determine, involves investigating why it has a disproportionate number of prooftext, whether the topic at hand requires so many texts or, as might always be the case, something else is at work.

And this might even be enough. If a literary critic with little or know network training can use these network graphs to discover new regions of research potential and new questions to ask about the construction of corpora, then perhaps this work has already achieved its goal.

But that feels like such a weak note on which to end. Not only because it absolves us from having to learn anything new about the networks themselves, but also because there should be so much more to do with this technology other than generate ideas and make pretty pictures.

A circular graph of all the nodes in the September database, arranged by name

Sefaria 9-22-14

Not to discount either generating ideas or making art. The practice of displaying information in an unreadable form purely for its aesthetic appeal is valuable as an act of artistic creation. If another value of this work is a set of awesome looking pictures to hang by my desk…far be it from me to complain. They’ll look great next to the embroidered TARDIS. I said that I was in this for the visceral joy of working with texts and the delight in making things the with which I think. But I will concede that not everyone wants what I want. I think we—the academic community—see the artistic values of our work as byproducts and, overall, would prefer research methods that generate answers rather than questions. So I will address that approach as well.

I realize that, in this conversation, I’m leaving out large swathes of digital research up to and including the WhatEvery1Says topic modeling project going at UCSB right now under the leadership of the 4Humanities group there. Using digital tools to interpret literary texts, while not free from controversy, has a pretty impressive track record and allows us to think anew about what we know and how we know it. But for many of these approaches, the images are secondary. They are elegant methods of displaying the information detailed in the critical literature itself. I’m talking about the actual value of taking information and transforming it into a visualization as a way of answering questions about a work or a corpus. To put the question another way, when is it better to see information than to read it?

And here’s where I think we start to see the value in making visualizations and knowing network theory. This kind of research is useful for destroying the linear thinking that narrative naturally invites. Database thinking (see Manovich in Language of New Media and Hayles in How We Think) has similar results in theory, but is comparatively useless to us as human beings in practice. We can’t read databases. We have tools that can, but what we end up reading or, realistically, seeing is the visual representation of the connections that are not apparent when traversing the work. Visualization breaks narrative. And sometimes, that’s what we want.

We want to break out of a narrative approach to, for example, the corpus of Jewish texts as a way of rethinking the legal, cultural and social influences that the texts have on one another. Here are some questions that, I hope, work like this might aspire us to answer.

  • How accurate is the vision of the Jewish legal system as a ladder with each subsequent generation relying on the scholarship that came beforehand? Do more recent writers hearken back to the earlier legal scholars or do they go straight to the Talmud or do they skip the legal sources in their own writing and rely entirely on the Biblical texts? What, in short, does a community of scholars look like?
  • Do scholars in different eras work differently? Are scholars more likely to refer to their predecessors in certain times than in others?
  • How interconnected are the commentaries? How often do they quote one another?
  • How interconnected is the corpus as a whole? Can you start anywhere and get back to Genesis 1:1? Which texts are inaccessible and do they share any features?
  • How much of the corpus is a dead end? And are dead ends characterized by any specific features?

We can’t read this information in the texts, but we can see it by looking at the visualizations. Which brings me to the end of this series, but to the beginning, I hope, of much research. All this data is available at Github and I welcome you to use it as you see fit.

As for me? Well, I’ve a dissertation to write and the data-viz work that I’ve been doing here is going to be a big part of that. And while my next post won’t be about Sefaria per se, let’s just say I still have a lot more to talk about when it comes to making meaning using network graphs.


  1. Last year, there was a…controversy over a specific decision made by a school principal when two of his students asked him to rule on a matter of law for them. I don’t want to get into the details of the controversy, but one of the loudest objections came from a rabbi who argued that simply having access to the sources to back up one’s opinion (he noted the Bar Ilan CD in particular) did not give someone the right to rule when more prominent rabbis disagreed with that ruling.
    Leaving aside that the principal in question is absolutely not the kind of person who would scour a database for one minor dissenting opinion rather than using his own knowledge to rule as he sees fit, this argument points to a more pervasive fear within all scholarly culture.
    Has the database replaced human memory? And can you really claim mastery over a topic if the mastery you have is, in fact, over the information seeking in the database?
    Conversely, can you claim mastery without the database? One of the points that I think the Sefaria graph makes elegantly is that there is really is (and always has been) “Too Much to Know,” to borrow the title of Ann Blair’s book on the subject. Is human knowledge of the canonical sources better than having a functioning database of every source? How do we rank knowledge without a canon?
    Given that my attitude towards technology can very broadly be summed up as “technology you do not like will not go away because you do not like it, so the only choice is to make it better”, I would argue that we need to train Jewish legal scholars in both forms of study. Legal precedent (unlike literature) has a better argument for the maintenance of the canon, but I think we do our laws and ourselves a disservice if we don’t take advantage of what technology can do and realize a system for using it to better understand and, yes, rule on Jewish law.
    Still, this point applies to relatively few people – the rabbis and not-rabbis responsible for handing down legal rulings. So let’s return to pedagogy. 
  2. A claim I don’t quite have the space to back up here, but I’m working on something that will address it. It’s called my dissertation. 

Sefaria II: The Map, the Territory and the Sukkah

My first post in this series dealt with the possibilities of Sefaria and what mapping such a system would look like at all. This, my second post, will jump to the opposite end of the spectrum. What are the limits of this kind of work and, perhaps more crucially, how do we make those limits work for us?

But first, a status update:

As many of you probably already noticed, the previous post in this series was featured in Wired’s science blog. You can find it here: The Network Structure of Jewish Texts. I was thrilled to have the work featured and I am so glad to see The Sefaria Project getting this kind of recognition.

Speaking of the project, a recent update to the database has increased the number of links from ~87,000 to over 150,000. This is incredibly exciting (obviously!) because it not only marks Sefaria’s continued growth, but also means that I have more data. So future posts in this series will draw on that new dataset as well and I’m looking forward to some comparative visualizations as well.

But enough about the future. Let us return to the past and the other visualizations I created with the first data set.

After negotiating with the 100,000+ nodes, I decided that I wanted something on a slightly more humanly sensible scale. I took the dataset I used for the previous visualizations and combined the nodes so that each node no longer represented a verse or a small section, but an entire book. This meant I only had ~400 nodes, a far more legible graph (at least by my standards).

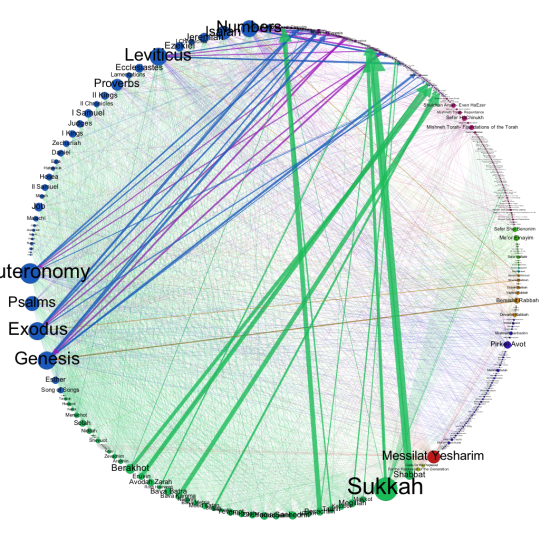
Figure 1

So this is the map, arranged in a circle according to the category of text. The size of the node corresponds to the degree (how many connections it has) while the color corresponds to the kind of node. Edge weight or line thickness corresponds to how many connections exist between each node. The thicker the edge, the more references between the source node and the target.

Here is the key to the map:

  • Blue: Biblical texts
  • Green: The Talmud
  • Red: Mussar
  • Indigo: Mishnah
  • Yellow: Midrash
  • Green: Philosophy
  • Magenta: Halacha
  • Purple: Commentaries and Exegeses

This image tells a very different story than the map in the last post.  That map was a big data artifact (for a given value of big); it worked on the micro level to create macro sized connections. This graph is human scaled, which makes it more interesting to interpret, but perhaps less interesting to discuss observations about.

The strongest connections (by which I mean the thickest edges) are between the individual books of the Talmud and Rashi’s commentary on that book. Almost as thick are the connections between the five books of the Torah and their commentaries. This is not surprising. Rashi is the exegetical commentator for the Talmud; his commentary appears on the inside of every page and, as Haym Soloveitchik points out in his essay on the printed of the Talmud page, Rashi democratized the Talmud. Rashi is an indispensable learning aid, which also explains why Sefaria might make it a high priority to have all those links in place. This tracing of explicit references is the area in which Sefaria excels. Of course, there are other kinds of connections.

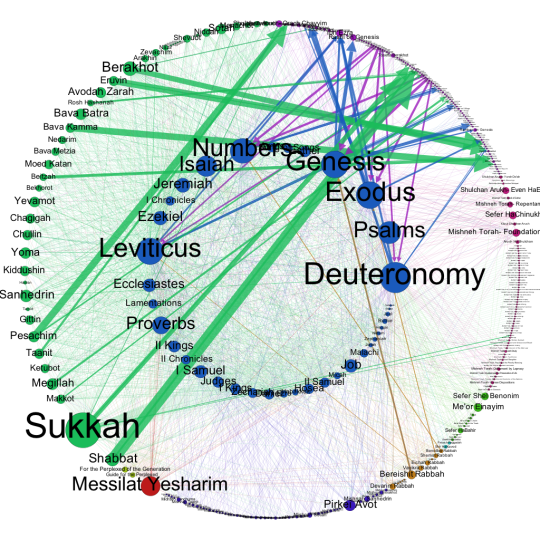
The Bible, specifically the five books of the Torah, are an interesting case study in what the current database can and cannot display. The most interesting piece of information, at least to me, is the paucity of connections between the Biblical books themselves. My immediate reaction was “Of course there are so few links!” After all, the network of reference and commentary relies on the presence of texts further along the timeline that can speak of the earlier texts. And the Bible does not make a practice of citing its own chapter and verse (especially because the chapters as we know them were introduced over 1,000 years after the closing of the canon). Figure 2 gives a better sense of what I’m talking about.

Figure 2

Figure 2

Here, you can see all the books of the Bible in the inner circle and, while there are some connections between the individual books (most notably the 5 books of the Torah to texts in Prophets and Writings), those edges seem scarce compared to the suffusion of green that encroaches from the Talmud’s corner and that signifies the interconnectedness of the Talmudic tractates.

Yet assuming that the Bible is not self-referential would be another kind of mistake. Many of the prophets speak about the covenant between God and Abraham, the exodus from Egypt, the calamities that might befall a recalcitrant king as they did that king’s father. And those are just the obvious, semantic references. The poetry of the prophets, the psalms and the language of the 5 megillot are just some examples of texts that use literary allusion and similarities of language to reference one another. So the network of references within the biblical texts are present, but they are not really the kind of references that Sefaria is set up to import wholesale. This is where the crowd-sourced nature of Sefaria really has a chance to shine; in a few years, it can become a repository of all the different possible connections between texts – an archive of what people think they see and how readers work with the texts. Sefaria has this capability built in – there is an option to add “allusion”s between one text and another, but those have to be added manually and individually. So check back in a few years.

This leads towards the point I allude to in my title. The graph is not really a record of Jewish texts as such, but a record of these texts as they are integrated into Sefaria. To borrow a well-known quote from Alfred Korzybski, “the map is not the territory”. Bearing this useful adage in mind, we can turn to what was my biggest question when looking at this graph. What is going on with Sukkah?

Sukkah is one of the 37 tractates of the Gemara*. It is neither the longest nor the shortest, not the most complex to grasp, nor the simplest. Based purely on my knowledge of the Talmud, I can’t think of a single reason why Sukkah should be far and away the largest of the tractates present.

And yet there it is. There are two possible kinds of answers. The first is that there is something special about Sukkah that sets it apart from the other tracates. Maybe there is something that I am not aware of or maybe this is a fascinating new discovery about the tractate itself. The second possibility is that something happened during the creation of this dataset to give Sukkah significantly more edges as compared to the other tractates.

The practical distinction between these two answers is that the former assumes that Sukkah is an actual outlier that is referenced significantly more often than the other tractates. The latter assumes that Sukkah is actually representative of what all the tractates should look like and the extra edges that it possesses represent data that has only been entered for Sukkah, but should eventually be added for the rest. (The third possibility is a data error. I’m discounting that because I looked back at the actual data and, as I’ll get to in a minute, it’s pretty clear that it’s not an error. But it is always wise to assume human error first.)

So which is it? How does one pinpoint which of the possibilities is more likely? Well, this is how I did it.

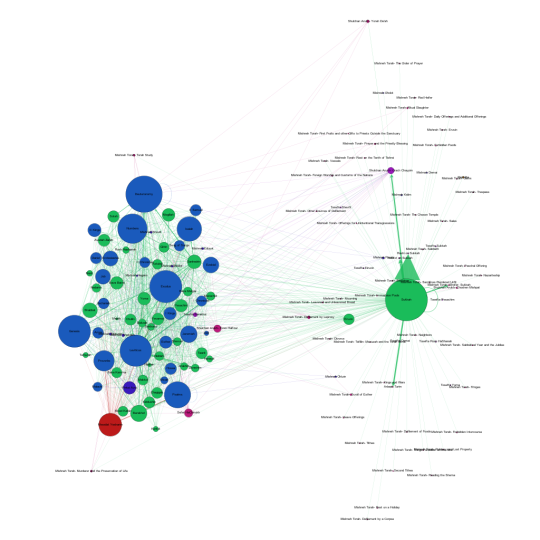
I created an ego graph of tractate Sukkah. The ego graph is a graph that shows only the nodes that connect to a specific node. So this graph shows all the nodes that connect, one way or another, to Sukkah.

Figure 3

Figure 3

The giant green blob in the hat is Sukkah. The collection on the left are all the biblical, Talmudic and halachic sources that refer to or are referenced in Sukkah. But what’s interesting is the cloud of small nodes surrounding Sukkah on the right. Those nodes are almost entirely from Maimonides’ Mishneh Torah, one of the foremost works of halachic literature and, more crucially for our purposes, a text that references pretty much every tractate of Talmud. There should be edges between the Mishneh Torah and each and every green node here. The absence of those edges suggests that it is the dataset that is incomplete and that Sukkah, rather than an outlier, is the node that most closely represents the textual connections that exist.

So that’s cool. By looking at the node as an extraordinary case, we uncover evidence of its ordinariness. That leaves us with an entire different set of questions. What happened to Sukkah? Why did someone take the time to add all these edges to Sukkah?

I can think of several possibilities.

  1. Daf Yomi. Daf Yomi is the practice of learning one folio (front and back) of Gemara a day and, in 7 1/2 short years, completing the entire Talmud. About 6 months ago, Daf Yomi covered tractate Sukkah. It’s possible that some Daf Yomi scholar discovered Sefaria right when he (statistically speaking, Daf Yomi scholars are he) started Sukkah and decided that, as part of his daily study, he would add the connections between the Talmud and the Mishneh Torah. This doesn’t explain why he stopped after Sukkah – there have been four tractates since Sukkah  – but it’s a start.
  2. Pedagogy. An educator decided to introduce the concept of the halachic chain of tradition  using digital tools and assigned their students to collaboratively edit Sukkah by adding the connections between the section they were learning and the halachic literature. So, as part of a classroom module, these students entered this data. This seems like a lot of data for students to enter manually, but it is certainly a possibility.
  3. It was a test of an automatic importing system. The powers that be were testing to see whether they could import the edges between the Talmudic texts and their halachic commentaries . Sukkah just happened to be the one they tested.

There are probably more possibilities, but I think that covers the basic kinds of users – the scholar, the educator, the technologist. Each of whom could be responsible for this anomaly. (By the way, if any of my readers have inside knowledge and knows what actually happens, I would appreciate anything you have to say.) When looking at a dataset like this, I find that my inclination is to start asking about the data. What would it mean to ask instead about the users and the development of the dataset? Or, to indulge in both my impulses, how can we study the data and the dataset in tandem? How do we mediate between the impulse to assign meaning to the data and the equally compelling impulse to assign it to the dataset? What exactly should I be studying?

And that is the question with which I leave you with and to which I invite your responses. What intrigues you about these visualizations? What would you like to talk about? In the crowd-sourcing spirit of Sefaria, I would like to augment my questions with yours. What would you like to know?

*Brief technical note – the Mishnah and the Gemara together make up the Talmud. However, both the term “Talmud” and “Gemara” are colloquially used to refer to the tractates that include the Mishnaic text and the Gemara that accompanies it.

Sefaria in Gephi: Seeing Links in Jewish Literature

How do you visualize 87,000 links between Jewish texts?

The answer, at least when one is working on an ordinary iMac, is very slowly.

The better–by which I mean more accurate and productive–question is: How do you meaningfully visualize the relationships between over 100,000 individual sections of Jewish literature as encoded into Sefaria, a Living Library of Jewish Texts?

The key term for me is meaningfully – working at this scale means I have to get out of my network comfort zone and move from thinking about the individual nodes and their ego networks towards a holistic appreciation of the network as a structural entity. I’m not able to do that quite yet, at least not in this post. This is the first post in a series of explorations  – what kinds of graphs can I make with this information and what information can I get from it (or read into it)?

This project and, perforce, this series is another side of the research questions that I’m currently grappling with – how do the formal attributes of digital adaptations affect the positions we take towards texts? And how do they reorganize the way we perceive, think about and feel for/with/about texts?

Because this is Ludic Analytics, the space where my motto seems to be “graph first, ask questions later,” it seemed an ideal place to speculate about what massive visualizations can do for me.

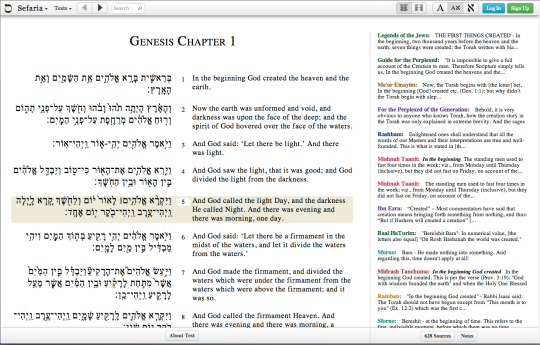
Let’s begin with a brief overview of Sefaria. Sefaria is a comparatively new website (launched in 2013) that aims to collect all the currently out-of-copyright Jewish texts and not only provide access to them through a deceptively simple interface, but also crowd-source the translations for each text and the links between them. For example, the first verse of Genesis (which we will return to later) is quoted in the Talmud (one link for every page that quotes it), has numerous commentaries written about it (another link for every commentary), is occasionally referenced in the legal codes and so on. Here’s a screenshot of the verse in Sefaria.

Genesis 1:!

Sefaria Screenshot

You can see, along the sides, all the different texts that reference this one and, of course, if you visit the website, you can click through them and follow a networked thread of commentaries like a narrative. Or like a series of TVTropes articles.

Sefaria did not invent the hyperlinked page of Rabbinic text. Printed versions of the Bible and the Babylonian Talmud and just about every other text here–dating all the way back to the early incunabula–use certain print conventions to indicate links between texts and commentaries, quotations and their sources. The Talmud developed the most intricate page by far, but the use of printing conventions such as font, layout and formal organization to show the reader which texts are connected to which and how is visible in just about every text here.

What Sefaria does (along with any number of other intriguing things that are not the topic of this post) is turns print links into hyperlinks and provides a webpage (rather than a print page) that showcases the interconnectedness of the literature. Each webpage is a map of every other text in Sefaria that connects to the section in question, provided that someone got around to including that connection. Thus we see both the beauty and the peril of crowdsourcing.

So the 87,000 links to over 100,000 nodes that I was given (thank you @SefariaProject!) are not exactly a reflection of over 2,000 years of Jewish literature as such, but a reflection of how far Sefaria has come in crowdsourcing a giant digital database of those 2,000 years and how they relate to one another. That caveat is important and it constrains any giant, sweeping conclusions about this corpus (not that I, as a responsible investigator, should be making giant sweeping conclusions after spending all of two weeks Gephi-wrangling). Having said that, the visualizations are not only a reflection of Sefaria’s growth, but also a way to reflect on the process of building this kind of crowd-sourced knowledge.

But before subsequent posts that analyze and reflect and question can be written, this post in all its multicolored glory must be completed.

To return to my very first question,  how do you visualize 87,000 links?

Like this:

Sefaria in OpenOrd

Figure 1


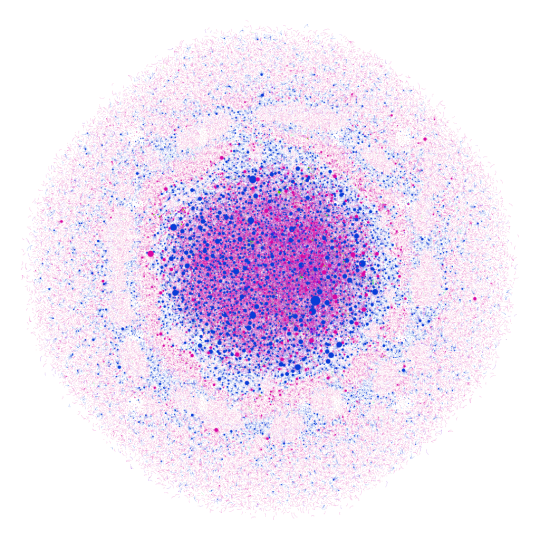
This is Sefaria. Or a cell under a microscope. It’s hard to tell. Here’s the real information you need. This graph was made using the Gephi plugin for OpenOrd graphing, a force directed layout optimized for large datasets.* The colors signify the type of text. Here’s the breakdown.

Blue – Biblical texts and commentaries on them (with the exception of Rashi). Each node is a verse or the commentary by one author on that verse.

Green – Rashi’s commentaries. Each node is a single comment on a section

Pink – The Gemara. Each node is a single section of a page.

(Note – these first 3 make up 87% of the nodes in this graph. Rashi actually has the highest number of nodes, but none of them have very many connections)

Red – Codes of Law. Each node is a single sub-section.

Purple – The Mishnah. Each node is a single Mishnah.

Orange – Other (Mysticism, Mussar, etc.)

The graph, at least as far as we can see in this image, is made up almost entirely of blue and pink nodes and edges. So the majority of connections that Sefaria has recorded occur between Biblical verses and the commentaries, the Gemara and Biblical references and the Gemara referencing itself.

Size corresponds to degree – the more connections a single node has, the larger it is. The largest blue node is the first verse of Genesis.

On the one hand, there is an incredible amount of information embedded in this graph. On the other hand, it’s almost impossible to read. There are some interesting things going on with the patterns of blue nodes clustering around pink nodes (the biblical quotations and their commentaries circling around the pages of the Gemara that reference them, perhaps?), but there are so many nodes that it’s hard to tell.

There’s also a ton of information not encoded into the graph. Proximity is the biggest one. There is absolutely nothing linking the first and second verses of Genesis, for example. Arguably, linear texts should connect sequentially and yet the data set I used does not encode that information. So this data set conveys exclusively links across books without acknowledging the order of sections within a given book.

But, as I told my students this quarter, the purpose of a model is not to convey all the information encoded in the original, but to convey a subset that makes the original easier to manage. This model, then, is not a model of proximity, It is purely a model of reference. Let’s see what happens when we look at it another way.

Sefaria All X-InD Y-OutD BC Book

Figure 2

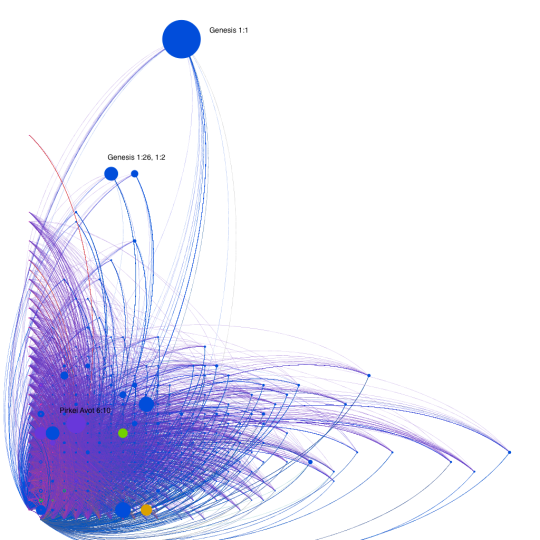
Gephi does not come with a spatial layout function, but there are user-created plugins to do this kind of work. This is the same dataset as above, except arranged on a Cartesian plane with the X axis corresponding to In Degree (how many nodes have that node as a target for their interactions) and the Y axis corresponding to Out Degree (how many nodes have that node as a source for their interactions).** The size corresponds to a node’s Betweenness Centrality – if I were to try and reach several different nodes by traveling along the edges, the bigger nodes are the nodes I am more likely to pass through to get from one node to another.

The outlier, obviously, is Genesis 1:1. It has far and away the most connections and, especially based on its height, is the source for the greatest number of interactions. (That probably means that, out of all the information Sefaria has collected so far, the first verse of Genesis has the most commentaries written about it). It’s not the most quoted verse in Sefaria, that distinction belongs to Exodus 12:2 (the commandment to sanctify the new moon, for those who are wondering). Second place goes to Deuteronomy 24:1 (the laws of divorce) and third goes to Leviticus 23:40 (the law of waving palm branches on Succot).*** So for this data set, most quoted probably signifies most often quoted in the legal codes in order to explicate matters of law. And while the commentaries tend to focus on some verses more than others, the codes seem to rely almost exclusively on a specific subset of verses that are related to the practices of mitzvoth. I think I was aware of this beforehand, but the starkness of the difference between Genesis 1:1 and Exodus 12:2 is still surprising and striking.

Working with Betweenness Centrality as a measure of size was interesting because it pointed towards these bridge texts – statistically speaking, Genesis 1:1 is the Kevin Bacon of Sefaria. You are more likely to be within 6 degrees of it than anything else.

There are a few other interesting observations I can make from this graph. The first is that the Gemara is ranged primarily along the Y axis, suggesting that the pages of the Gemara are more rarely the target for interactions (which is to say that they are not often quoted elsewhere in Sefaria) ,but more often the sources and, as such, quote other texts often and have substantial commentaries written about them. Because one of the texts quoted on a page of Gemara is often another page of Gemara, you do see pages along the X axis, but none range as far along the X axis as along the Y. While there are texts that are often the target of interactions, the Gemara is, overall, the source.

This is in contrast to the Biblical sections, which occupy the further portions of the X axis (and all the outliers are verses from the five books of the Torah). So the graph, overall, seems to be shading from pink to blue.

Which brings me to another limitation in my approach. Up until now, I have been thinking about these texts as they exist in groups, using that as a substitute for the individual nodes that would ordinarily be the topic of conversation. So what happens when I create a version of the graph that uses color to convey a different kind of meaning and no longer distinguishes between types of texts?

Sefaria All X-InD Y-OutD BCsize Dcolor

Figure 3

Sefaria, taste the rainbow.

In this graph, color no longer signifies the kind of text, but the text’s degree centrality. The closer to the purple end of the rainbow, the higher number of connection the node has. Unsurprisingly, Genesis 1:1 is the only purple node.

It’s interesting to note that the highly connected nodes on the right of the graph are all connected to a large number of lower level nodes. There are no connections between the greens and yellows near the top of the page and the blues down on the right. Why is there such a distinction between nodes that reference and nodes that are referenced? Why is the upper right quadrant so entirely empty? Does this say something about the organization of the texts or about the kinds of information that the crowd at large has gotten around to encoding? Or is it actually a reflection of the corpus – texts that cite often are not cited in turn unless they are in the first book of the Torah?

If you have any questions, thoughts, explanations, ideas for further research with this data set or these tools, suggestions for getting the most out of Gephi, please leave your comments below.

Coming soon (more or less): What happens when we look at connections on the scale of entire books rather than individual verses?

Bonus Graph: A Circular graph with Genesis 1:1 as the sun in what looks like a heliocentric solar system. Why? Well, it seemed appropriate.

Genesis 1-1 Concentric Graph Book MC

One note on this graph. You can see the tiny rim of green all around the right edge – those are the tiny nodes that represent Rashi’s commentaries and make up more than 1/3 of all the nodes in the graph. The inner rings, at least what we can see of them, tend towards Biblical verses and their commentaries. The Gemara is almost all on the outside. Of course, those distances are artifacts of deliberately placing Genesis 1:1 at the center, but they are interesting nonetheless.

*Force directed, to provide a very brief summary, means that the graph is designed to create clusters by keeping all the edges as close to the same length as possible. Usually it works by treating edges as attractive forces that pull nodes together and the nodes themselves as electrically charged particles that repulse one another.

**At least in this data set, the source is the text under discussion, so if one were to look at the connection between Genesis 1:1 and Rashi’s commentary on Genesis 1:1, the Biblical verse is the source and the commentary the target. Conversely, if one were looking at a quotation from Genesis in a page of the Gemara, the page of Gemara would be the source and the verse in Genesis the target.

***Based on further explorations of the data set according to less fine-grained divisions, I am convinced that anything having to do with the holiday of Succot is an outlier in this dataset. More on that in another post.